Standardising disparate data feeds for investment reporting and accounting
In our previous blog post, we wrote about how a broadly shared understanding of data is important in making decisions and aligning teams. In this post, we’ll talk about how the data flows from different banks and brokers into a standardised base for investment reporting and accounting purposes.
Challenges handling data from banks and brokers
First, we established data feeds with our banks and brokers (as discussed previously). Then, we placed the files in a central data store where we could query them efficiently.
Here are some of our observations:
Delimited text files contained just about any possible separator.
The text fields in CSVs came with metadata lines, blank lines, and even newlines.
Decimal precision and rounding can lead to large differences downstream, so we use exact decimal data types and only do divisions at the last minute (instead, we store the numerators and denominators in different columns).
While having machine-readable feeds from all the banks and brokers is great, the formats varied enough that we felt the need to construct a more standardised view.
We noticed the following differences in the data we received:
Variations in column names mapping to the same values
Differences in how bond market values and prices are presented in relation to accrued interest
Differences in the classification of assets as cash, money market, or other instruments
Conforming the data into a standard set of facts
While each bank has its own format and specific nuances on column names, types, and nomenclature, we’ve generally found that the feeds we can unify from different banks and brokers fall into three different categories:
Transactions: Movements in and out of instruments and accounts.
Holdings: A snapshot of every position we hold at the time. Sometimes, cash positions are provided in a separate feed.
Instruments: Metadata about instruments, such as coupon or dividend rates and maturities.
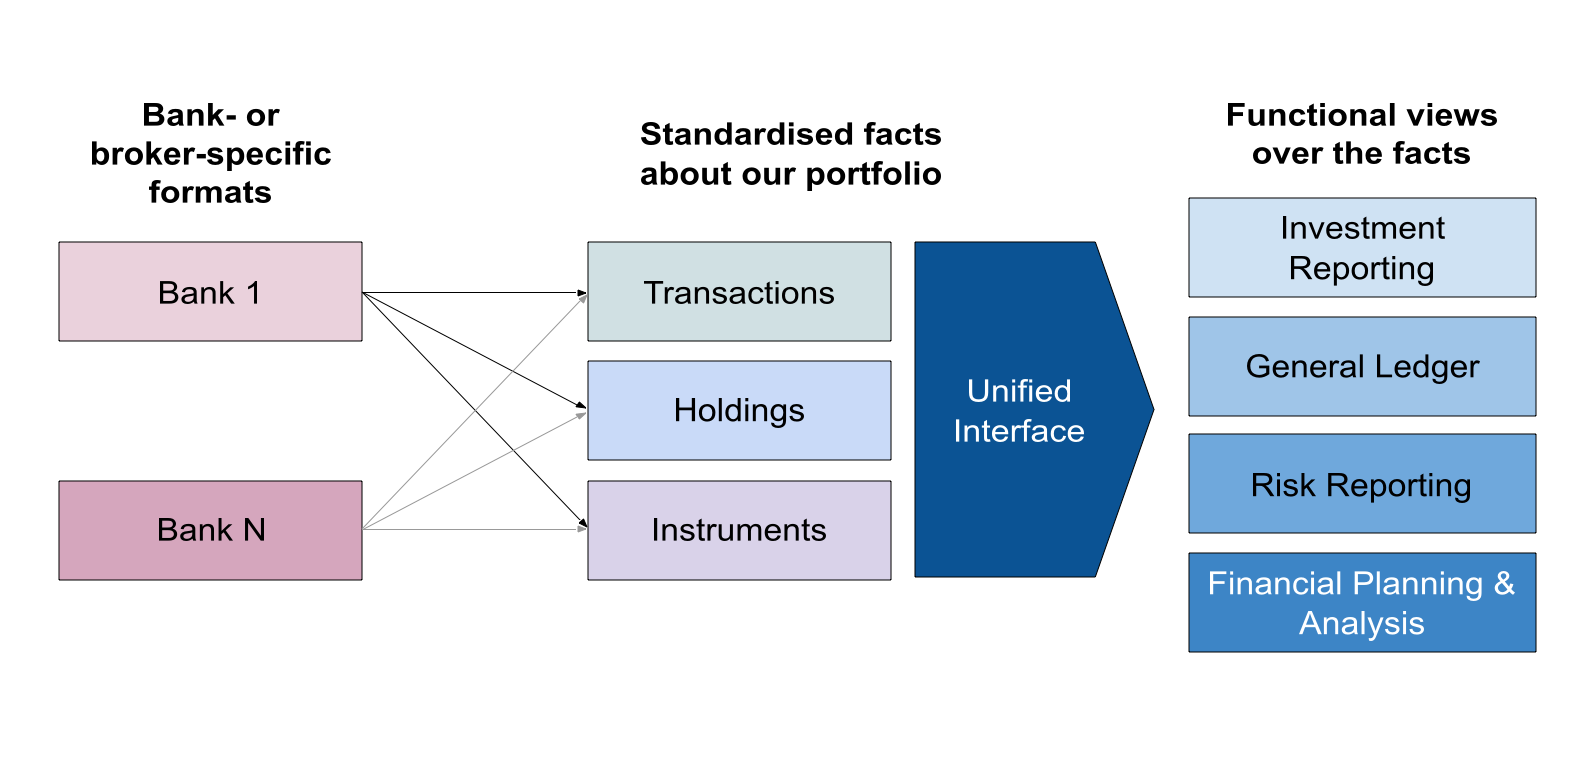
We used a very common star schema (facts and dimensions) to model different objects (such as transactions, custody accounts, and currencies). Then we transformed those into accounting-specific objects (such as journal entries) or investment-specific objects (such as unrealized gains and losses).
Because of this standard interface, when we integrate a new bank or broker, we simply have to conform the data and be confident that valid accounting journal entries and investment reports will be generated downstream.
Forking off into our accounting view
We’ve made it a principle to keep toil in our team to a minimum by leveraging robots to take care of routine tasks, including bookkeeping.
While our standard set of facts already contains a lot of the information we need to produce a full set of financial statements, we still need to apply some accounting-specific logic:
Transactions for accounting purposes need to be kept in their original currency and then translated to explicitly reflect the impact of foreign exchange fluctuations.
Intercompany transactions need to be eliminated during consolidation.
While investment reporting requires more granular, frequent updates, accounting requires updates that can be traced back to audit evidence.
We engaged SoftLedger, whose product can be fully integrated using APIs, to help us with the above challenges. We wrote glue code to feed in generated journal entries, and the software handled the intricacies of intercompany elimination, financial statement consolidation, and accounting period close.

Here’s an example of how SoftLedger automatically handles consolidation and eliminating entries.
Automating our bookkeeping processes
The idea of fully automating our bookkeeping can be met with a healthy amount of scepticism. It’s easy to imagine situations where a robot can go astray and generate completely wrong data! We’ve generally landed on a few approaches to make this safer and more reliable:
Reconcile early and often via automation. Once we have manually reconciled a table against the bank feed, we incorporate a balance check to ensure they never go out of alignment for that time period. We also include a URL to the backing invoice or bank statement — something our auditors found very useful! Here’s an example of how we specify our balance tests:

This is an example of how we specify balance tests, ensuring that the balances don't go out of alignment due to future code changes.
Test rigorously and fail fast. We’ve added a lot of testing at the source, transformation, and output steps, and we fail quickly at each step to ensure no data gets polluted. This has caused our build-and-test process to be a bit longer than we would have liked, but in the accounting view, we prioritised correctness over timeliness.
Sometimes there is no getting around having to supply manual data, such as when the purpose of a transaction isn’t obvious from the description or when we’re dealing with configuration items like the chart of accounts. We maintain our chart of accounts and other manual data in version control and sync it to SoftLedger via CI (continuous integration).
Off the back of this system, we were able to close and audit our Singapore books for the calendar year 2023 with only a very small fraction of journal entries manually generated. Future transactions are preliminarily booked on a T+2 basis. We also use the same data to create dashboards to minimise cash drag and monitor the portfolio on a daily basis.
Moving forward
Our solution is still under heavy iteration, and some problems linger for us to address:
Expanding our automated accounting setup to our entire portfolio
Finding vendors to help us process unstructured data coming from directly held investments
Using our consolidated source of truth for more areas, including risk reporting and financial planning
In a future blog post, we’ll discuss the details of how we perform each step of this process, starting with LedgerPigeon, a cloud-based system to collect and receive data about our portfolio.
Disclaimer: The content in this blog post should not be taken as investment advice and does not constitute any offer or solicitation offering or recommending any investment product.